Why the Frightening Thing Always Travels Further
Why do frightening crime stories travel so quickly? Research shows that fear, negativity and emotional content spread further, shaping how we perceive crime and safety in our own neighbourhoods.
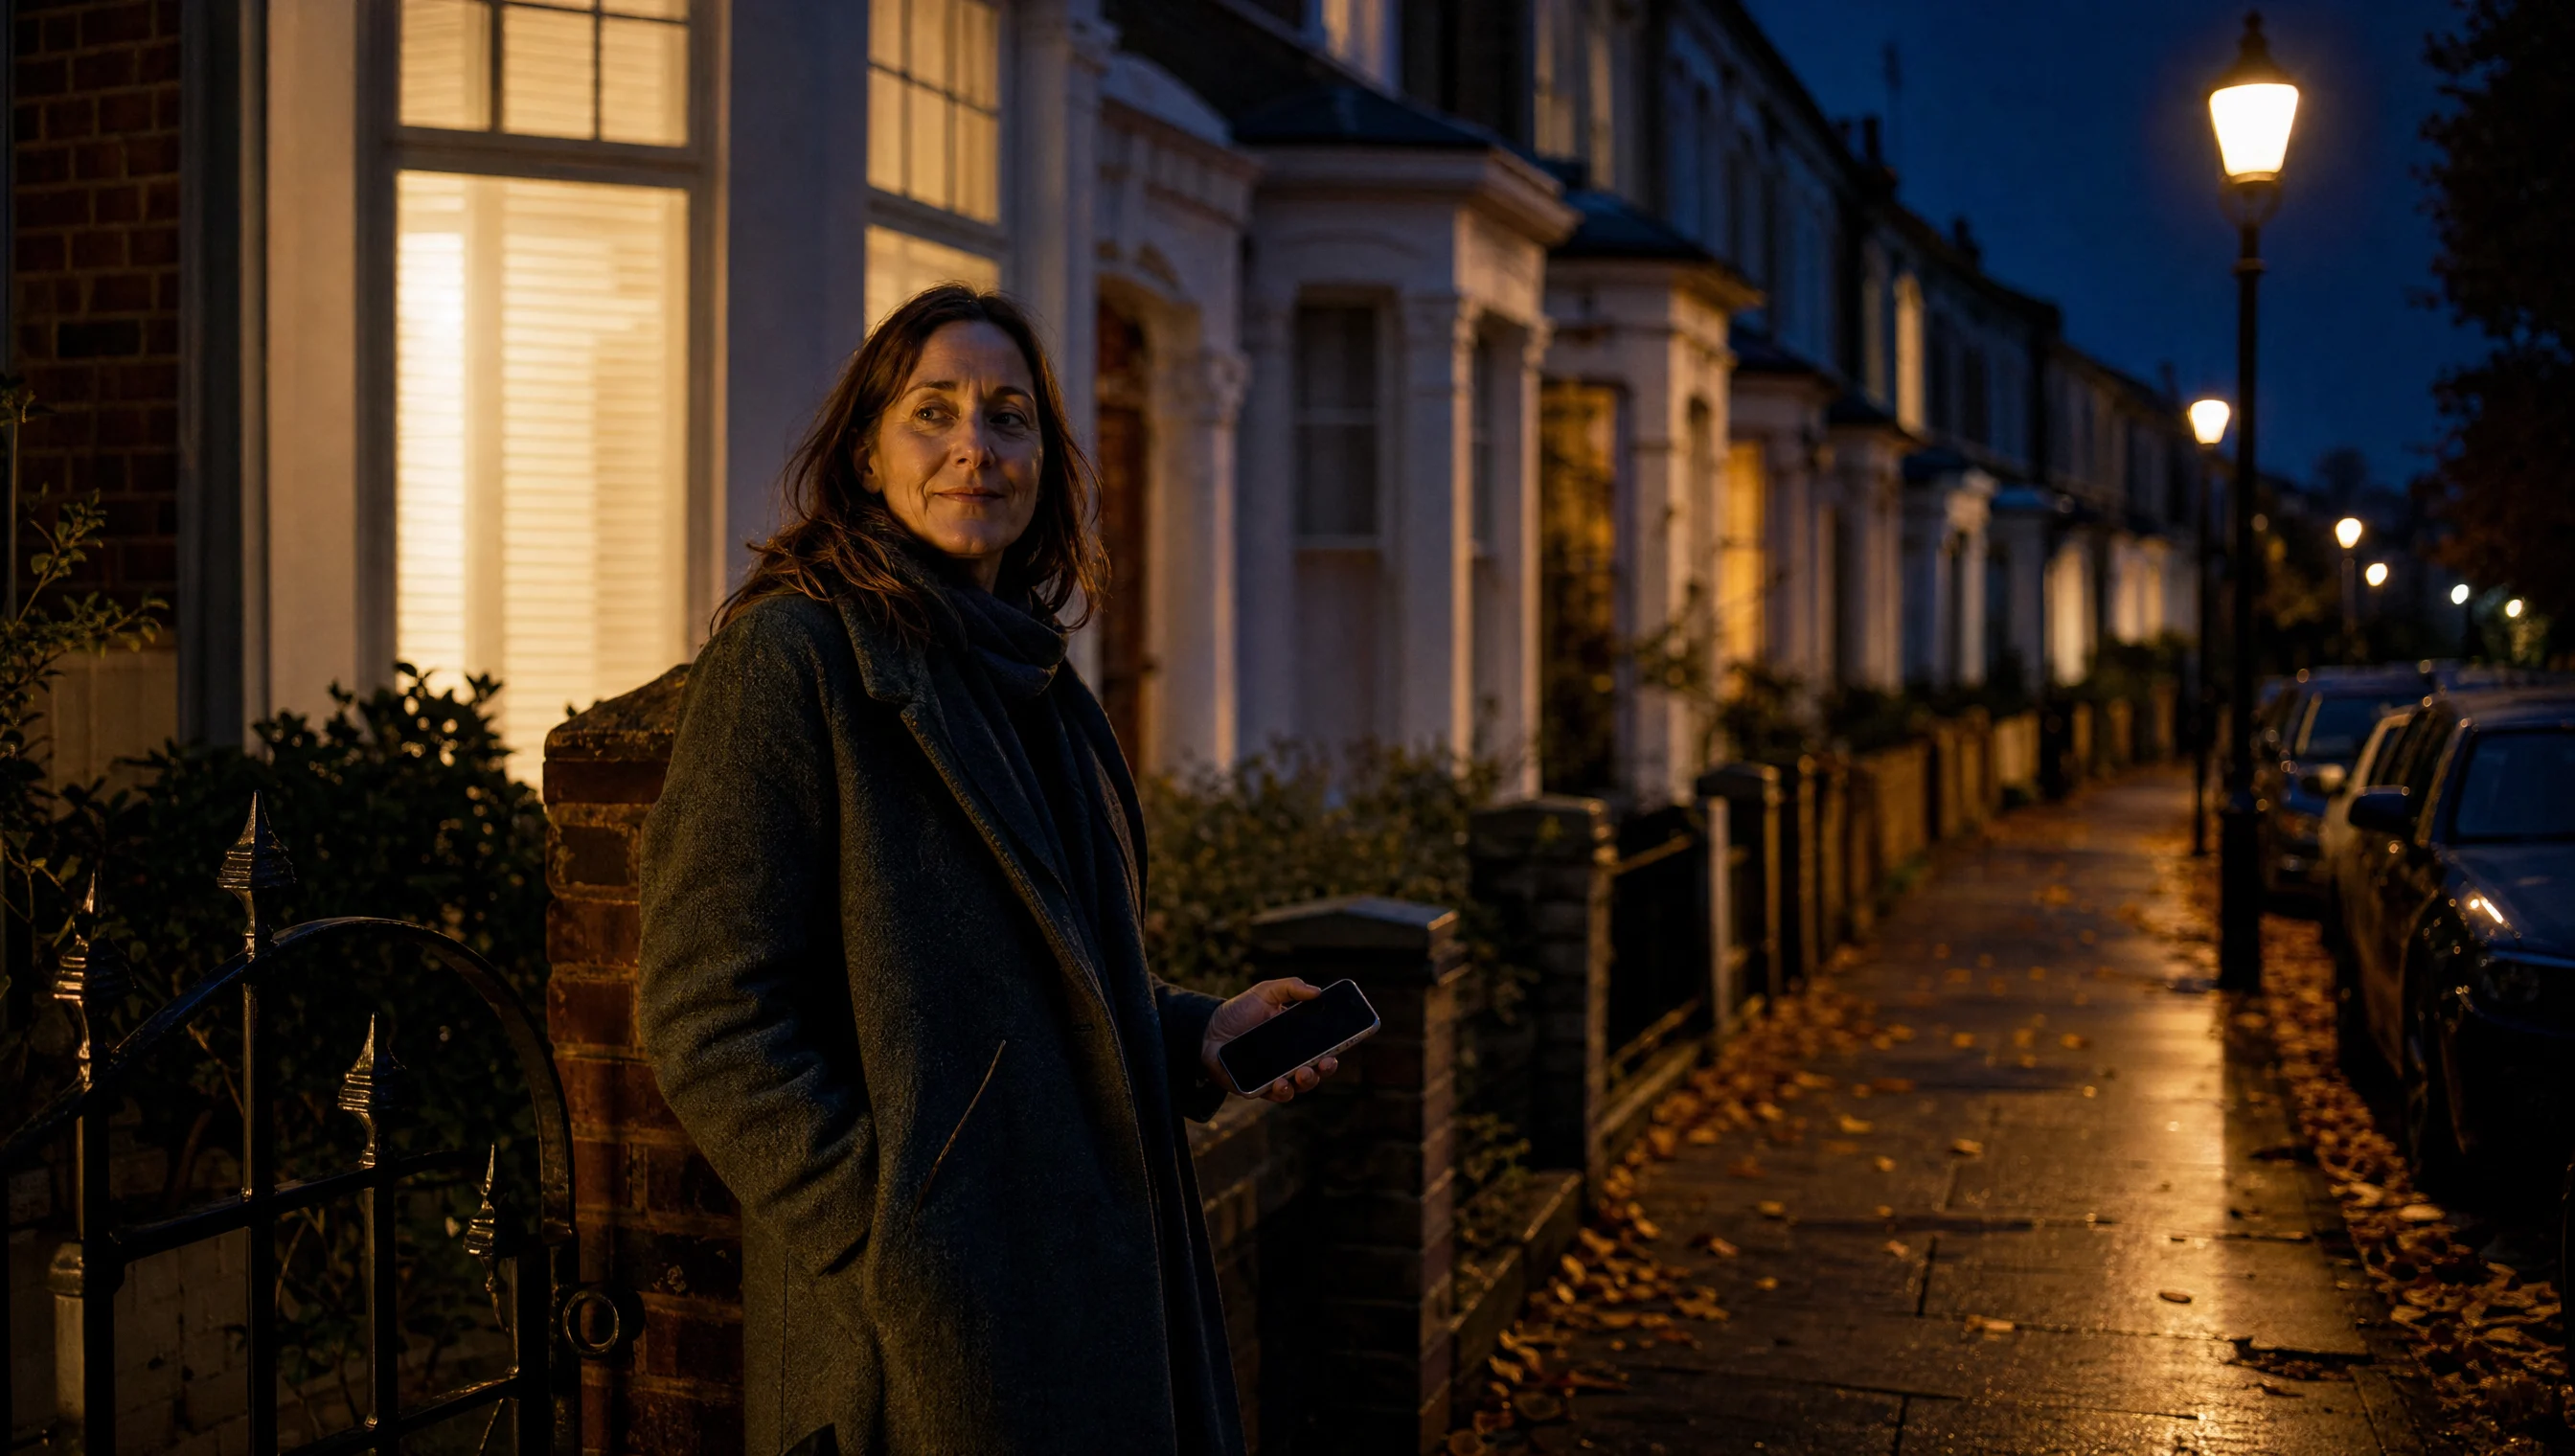
So you've seen the video. Someone's doorbell camera, a bit grainy, a figure trying car handles at 3am, and it's already been shared into four different group chats before it reaches you. It feels like it happened here. It might have happened three miles away, or last year, or in a different city entirely.
Here's the thing. That clip travelled to you because it frightened someone, not because it was true, and not because it was near you. Those are three completely different qualities, and only one of them decides how far something spreads. Researchers have now measured this properly, across millions of shares, and the numbers are worse than you'd guess.
This piece is about why that happens, what the evidence actually shows, and why we think it matters more than the crime rate itself. Fair warning: the uncomfortable part is at the end, where we explain why your street's WhatsApp group runs on exactly the same machinery.
Key Takeaways
- Falsehood spreads faster: False stories were 70% more likely to be shared than true ones in a study of 126,000 rumour cascades.
- Fear is the specific fuel: False stories provoked fear, disgust and surprise. True ones provoked sadness, joy and trust.
- Negative headlines get more clicks: Each additional negative word in a headline lifted click-through by 2.3%.
- Britons know where they got it: 78% of people who think crime has risen say it's because of things they've seen on the news.
- The gap is local: 67% think crime rose nationally. Only 39% think it rose in their own area.
- Nobody has to be lying: This is an equilibrium, not a conspiracy. Every actor optimising for attention lands in the same place.
- Your street group isn't immune: Any system where sharing decides distribution obeys the same physics.
The Study That Should Change How You Read Your Feed
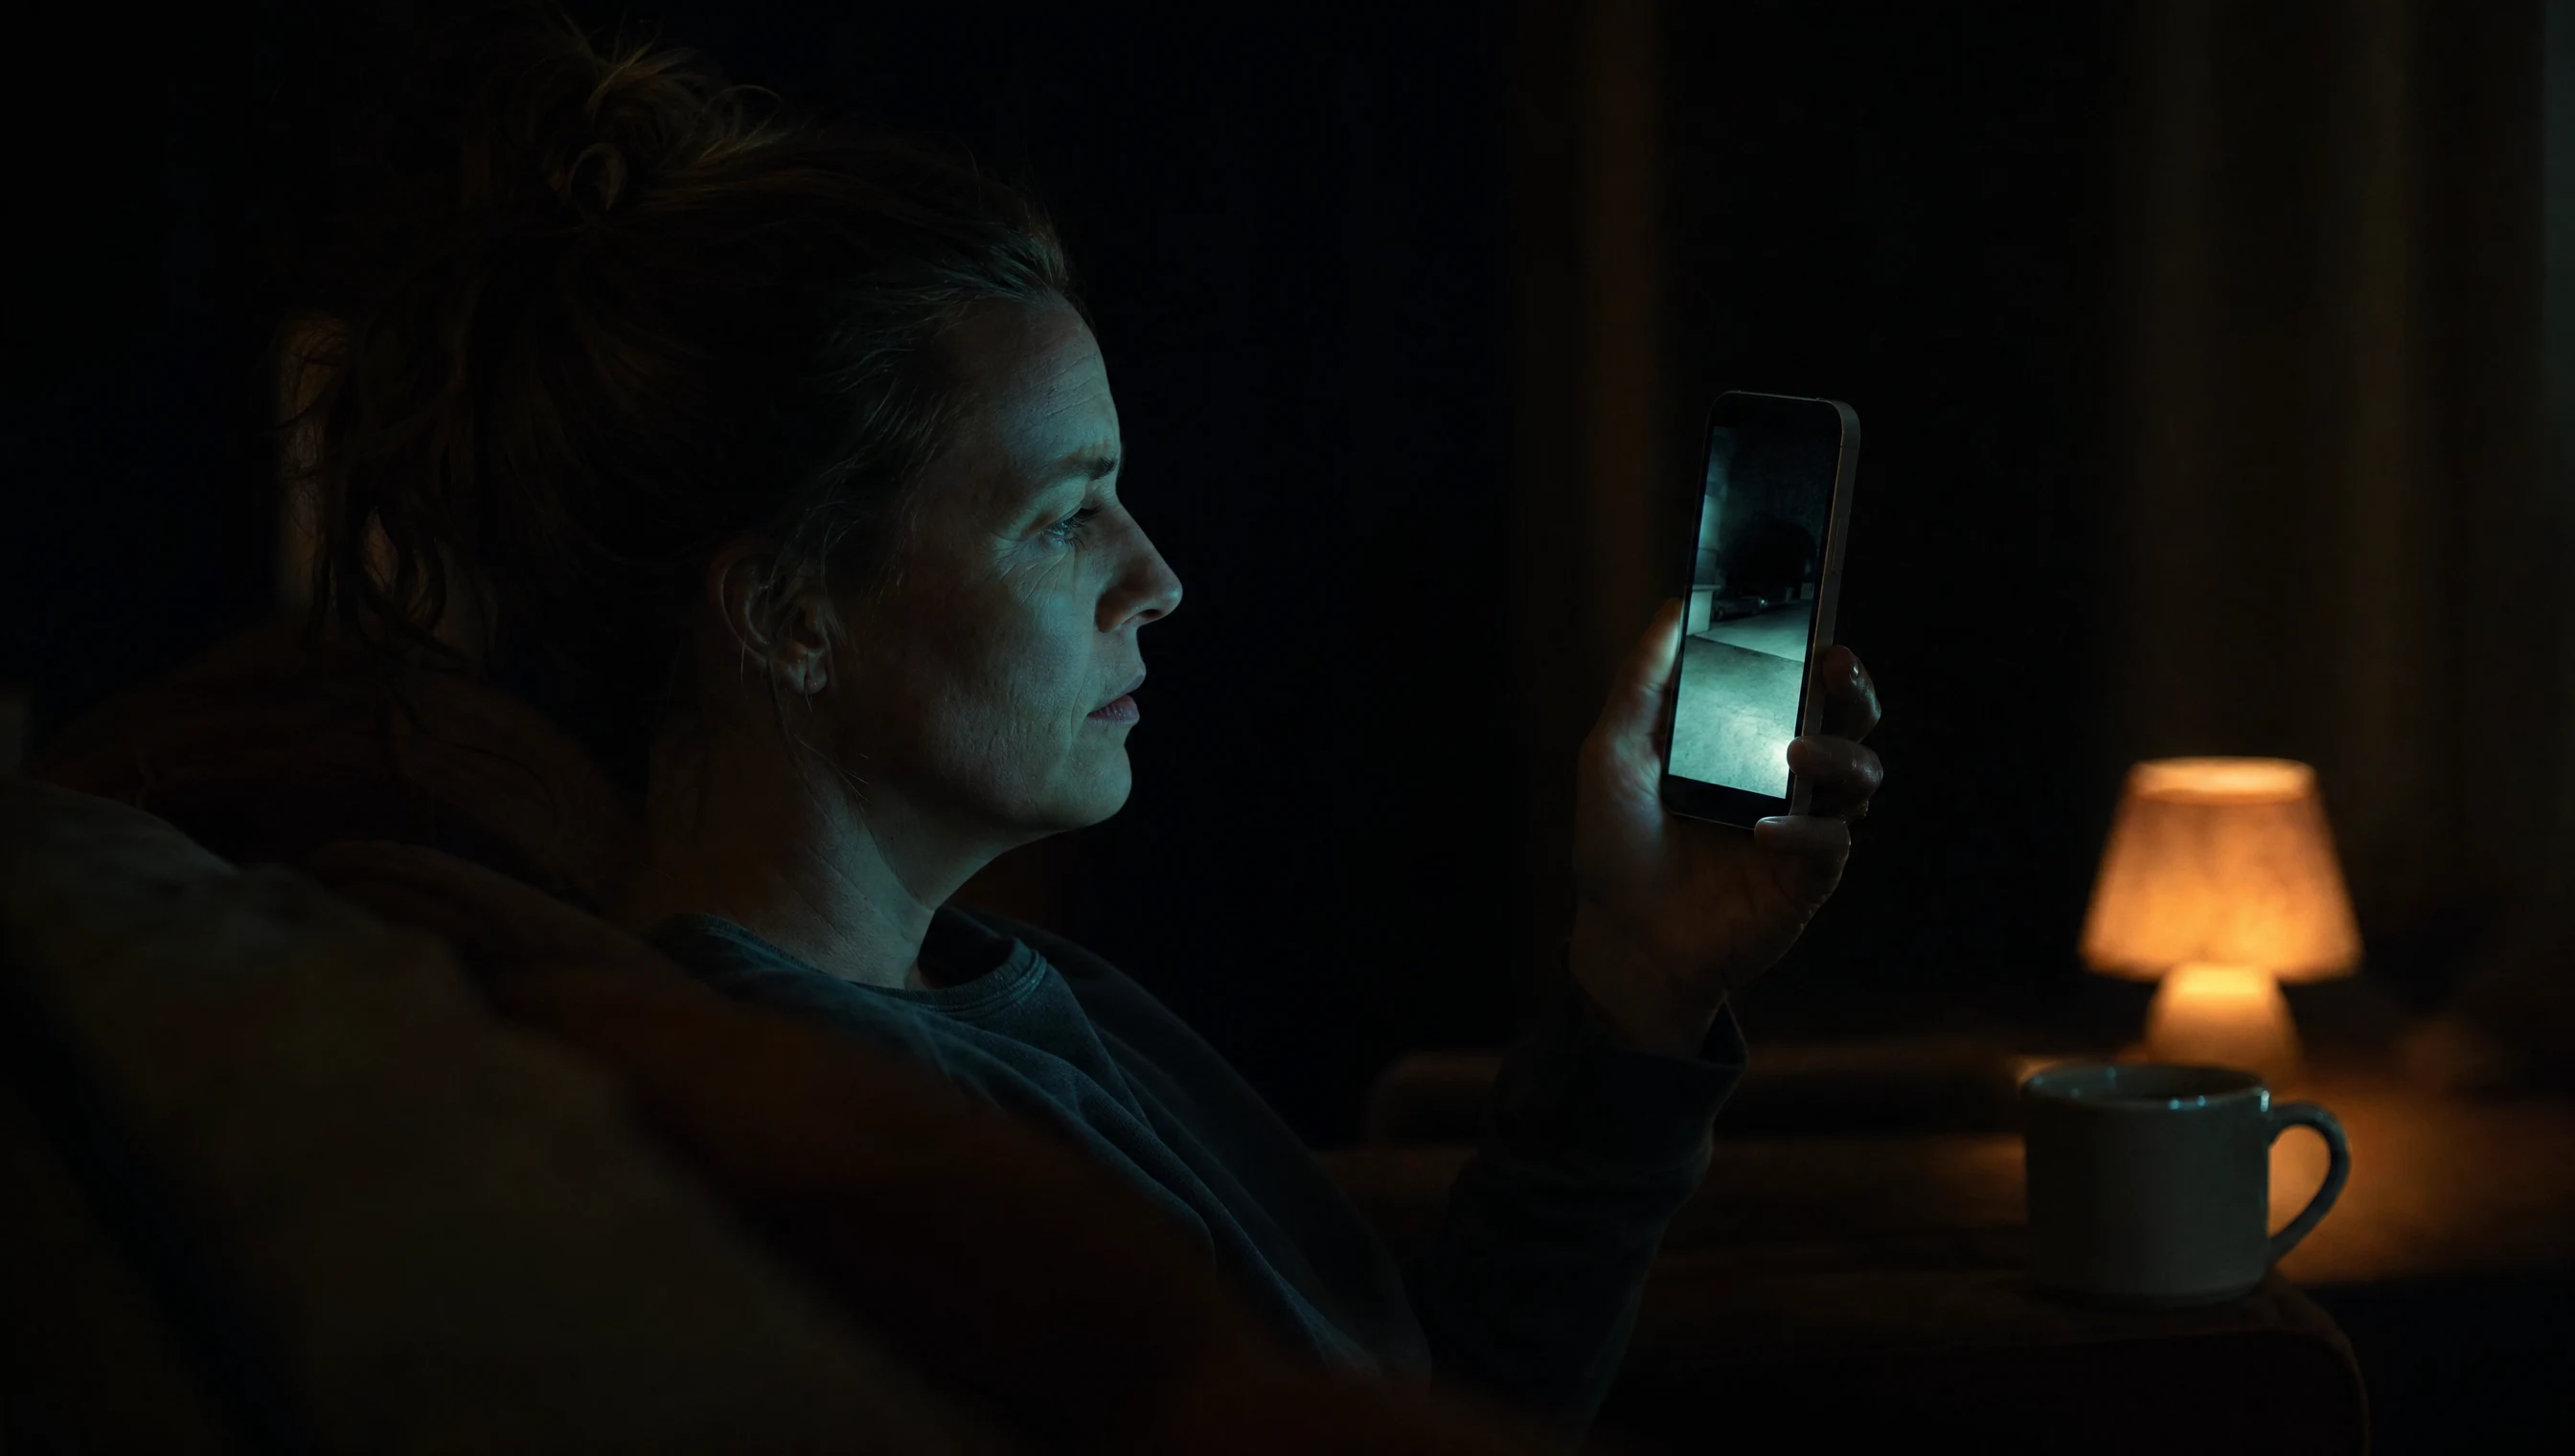
Let's start with the big one.
In 2018, three MIT researchers published a study in Science that looked at roughly 126,000 rumour cascades, spread by about 3 million people, over eleven years of Twitter data. It remains the largest thing of its kind, and the finding was blunt. Falsehood diffused significantly further, faster, deeper and more broadly than the truth in every category they measured.
The headline number: false stories were 70% more likely to be retweeted than true ones.
The scale difference is worth sitting with. The top 1% of false cascades reached between 1,000 and 100,000 people. True stories rarely reached more than 1,000. That's not a small edge. That's a different order of magnitude, produced by the same platform, on the same day, about the same events.
And before anyone blames bots, the researchers checked. When they removed automated accounts from the dataset, the findings held. People were doing this.
It's Not the Lies. It's the Emotion.
Here's the part that matters most for a safety product.
The researchers ran sentiment analysis on the replies to true and false stories, and the emotional signatures came out completely different. False stories inspired fear, disgust and surprise. True stories inspired anticipation, sadness, joy and trust.
Read that again, because it's doing a lot of work. The thing that made a story travel wasn't that it was false. Falsity was a proxy. What actually moved was novelty and threat, and false stories happen to have more of both available to them, because they aren't constrained by what happened.
A true story about your street has to compete against a false story about anywhere, and the false one gets to be as frightening as it needs to be.
Negative Headlines Simply Work Better
You might reasonably say that's social media, and news organisations are held to a higher standard. That's a fair objection, and it's been tested.
A 2023 study in Nature Human Behaviour analysed roughly 105,000 different headline variations that generated about 5.7 million clicks across 370 million impressions. Because the publisher was running randomised tests on the same underlying stories, the researchers could isolate the effect of the wording alone.
The result: for a headline of average length, each additional negative word raised the click-through rate by 2.3%. Positive words lowered it.
Nobody in that dataset had to decide to frighten anyone. They ran tests, kept what performed, and the negative wording won on its own. Do that a few thousand times across an industry and you get a media environment that is systematically more frightening than the world it describes, with no villain anywhere in the process.
Why Your Brain Goes Along With It
There's an obvious question sitting underneath all this. Why does threat travel further in the first place?
The short answer is that you don't estimate risk, you remember it. Amos Tversky and Daniel Kahneman named this the availability heuristic back in 1973: when we judge how likely something is, we don't retrieve statistics, we retrieve examples, and whatever comes to mind easiest gets treated as most common.
That would be fine if memories arrived in proportion to how often things happen. They don't. They arrive in proportion to how vivid, recent and emotionally charged they were. One doorbell video is retrievable. Four thousand uneventful nights on your road are not retrievable at all, because nothing happened, so nothing got stored, so nothing comes back when you go looking.
You aren't being irrational. You're using a shortcut that works well in most of life, on a diet of information that has been sorted specifically to break it.
What This Looks Like on a British Street
All of the above is measurable in the UK right now, and the numbers line up neatly.
Ipsos asked Britons in November 2025 whether crime had gone up. 67% said yes for the country as a whole, up from 58% only five months earlier. Then they asked the same people about their own area, and the figure dropped to 39%. Same people, same week, two very different answers depending on whether they were talking about somewhere they could actually see.
Then Ipsos asked the ones who thought crime had risen why they thought so. 78% pointed to things they had seen on the news, up from 68% in June.
So people aren't confused. They're accurately reporting where their impression came from. And when you compare that impression against the Crime Survey for England and Wales, which asks tens of thousands of people directly about what actually happened to them, the gap is large. The public's median guess for how many people are victims of crime in a year is 27%. The real figure is 9.7%.
Worth saying clearly: this is not an argument that nothing bad happens, or that people are silly for worrying. Fraud victims rose 10% last year to 3.8 million people, and reported harassment rose significantly. The point is narrower. The information reaching you is sorted by how it makes you feel, and that sorting has consequences.
The Uncomfortable Bit: Your Street Group Does This Too
Right, let's get to the part that applies to us.
Everything above is usually written as a criticism of big media or big platforms. It isn't really about either. It's about any system where the thing that decides distribution is how people feel when they read something. That describes a national newspaper. It also describes the WhatsApp group for your road.
Think about how a street group actually behaves. Somebody posts a grainy clip. It gets forwarded. Nobody forwards the fourteen quiet nights either side of it, because there's nothing to forward. Over a few months, the group's collective record of the street is a highlight reel of everything that went wrong, with all the ordinary evenings deleted.
The group didn't lie to anyone. It just has no mechanism for reporting that nothing happened.
That's the design problem, and it's why we don't think the answer is a better feed. A feed rewards posting. Reward posting and you get more of whatever gets shared, and we've just spent 1,000 words establishing what gets shared.
So What Actually Helps?
Two things break the loop, and neither of them is reassurance.
First, base rates. The antidote to a vivid story isn't a comforting story, it's a denominator. If you know what a normal week on your road genuinely looks like, a single incident lands as an incident rather than as evidence of collapse. Most weeks, that means being told almost nothing happened. It's a strange thing for an app to say and it's the most useful thing we can say, because quiet only counts as information if somebody is keeping count.
Second, proximity you can trust. People are already far better at judging their own street than their country. The 39% versus 67% split proves it. So the useful move isn't to give people more information. It's to give them information tightly bounded to a place they can verify, from people who've confirmed they actually live there.
That's why Glome reports at street level, why we ask people to confirm their address, and why we treat a quiet week as something worth telling you about.
Your Questions, Answered
Isn't this just saying the media lies?
No, and that's the interesting part. The Nature Human Behaviour study found the effect in headline wording alone, on stories that were otherwise identical. No falsehood required. The system produces a distorted picture out of accurate parts.
If crime is falling, why does Glome exist?
Because the gap between how safe you are and how safe you feel is itself a cost. 71% of women changed their route to avoid walking in the dark during the darker months. That's a real restriction on real lives, and it doesn't go away by telling people the statistics.
Doesn't a safety app benefit from people being frightened?
Commercially, in the short term, yes. That's precisely why it needs saying out loud, and why we've written a separate piece on what happens when safety apps follow that incentive.
Are you saying I should ignore what I see on my street group?
Not at all. Your neighbours are usually right about what they saw. The problem isn't their accuracy, it's the sampling. You're seeing every bad thing and none of the ordinary ones, and no individual post is at fault for that.
What to Do With Any of This
You don't need to stop reading the news or leave your street group. Two smaller habits do most of the work.
When something frightening reaches you, ask two questions before it lands: where did this happen, and when. Most forwarded clips fail one of those and stop feeling like evidence about your road the moment they do. Then, occasionally, ask yourself what the last quiet month looked like. If you can't picture it, that's not because it wasn't quiet. It's because nobody sent it to you.
That's the whole problem, in one sentence.
Glome is building a street-level safety network for Barnet, where reports come from people who've confirmed they live on your road, and where a quiet week gets reported as a quiet week. [Find out more about Glome].
References
1: Vosoughi, S., Roy, D. and Aral, S. (2018) 'The spread of true and false news online', Science, 359(6380), pp. 1146-1151. Approximately 126,000 rumour cascades spread by about 3 million people, 2006 to 2017. https://www.science.org/doi/10.1126/science.aap9559
2: Robertson, C.E., Pröllochs, N., Schwarzenegger, K., Pärnamets, P., Van Bavel, J.J. and Feuerriegel, S. (2023) 'Negativity drives online news consumption', Nature Human Behaviour. Approximately 105,000 headline variations, 5.7 million clicks, 370 million impressions. https://www.nature.com/articles/s41562-023-01538-4
3: Ipsos (2025) Majority of Britons think crime is a big problem, with 6 in 10 believing it has risen over the past year, November 2025. https://www.ipsos.com/en-uk/majority-of-britons-think-crime-is-a-big-problem-6-in-10-believe-it-has-risen-over-the-past-year
4: Tversky, A. and Kahneman, D. (1973) 'Availability: A heuristic for judging frequency and probability', Cognitive Psychology, 5(2), pp. 207-232. See also Tversky, A. and Kahneman, D. (1974) 'Judgment under Uncertainty: Heuristics and Biases', Science, 185(4157), pp. 1124-1131.
5: The Policy Institute, King's College London (2026) Wrongful convictions? Misperceptions about crime among the UK public, 17 August 2026. YouGov survey of 1,797 UK adults, 2,164 for the victimisation question, fieldwork 23 to 27 March 2026. https://www.kcl.ac.uk/news/public-perceptions-of-crime-at-odds-with-reality-study-finds
6: Office for National Statistics (2026) Crime in England and Wales: year ending March 2026, released 23 July 2026. https://www.ons.gov.uk/peoplepopulationandcommunity/crimeandjustice/bulletins/crimeinenglandandwales/yearendingmarch2026
7: YouGov for Active Travel England (2026). Survey of 2,125 UK adults aged 18+, fieldwork 17 to 18 February 2026. https://activetravelengland.gov.uk/news/nationwide-plans-announced-design-safer-streets-9-10-women-report-feeling-unsafe-walking-night